Eureka County Population Growth & Decline

Eureka County population was estimated to be 1,485 persons in 2005. This is an increase of 65 persons, or 4.5 percent, since 2003. The County's average annual population growth over the years 1993-2005 has been -0.2 percent - a negative growth rate overall. Population fell sharply in 1994, increased to a high of an estimated 1,895 persons in 1998, declined again reaching a low of 1,384 persons in 2003, then rose to an estimated 1,485 persons in 2005.

As a comparison, the average annual population growth rate of the state of Nevada over the period 1993-2005 was 4.86%. Eureka County is not alone in population decline, however. In the 1993 - 2005 period two other rural counties, Lander and Mineral, also lost population, while Lincoln County gained only slightly.

In Eureka County the greatest part of population change is due to in or out-migration. More people moved to Eureka County than left in the years 1996-99 and 2003-04, while more people moved out of the county in the years 1994-95 and 1999-2002. The rate of natural population change (births minus deaths in the county) was positive over all years in the twelve-year period except 1994. This "natural" increase is small, however: the year with the highest rate of natural increase is 1998, with an excess of births over deaths of 12 persons


Other Population Statistics for Eureka County

The graphs on the previous and following pages show other characteristics of the population of Eureka County as reported in U.S. Census 2000 and subsequent population estimates by the Nevada State Demographer.

Persons per Square Mile
Eureka County has an extremely low population density - only 0.34 persons per square mile, as compared to 22 persons per square mile for Nevada as a whole, and 83.8 persons per square mile nationwide. 51% of the estimated 2005 county population of 1,485 resided in the town of Eureka or Crescent Valley, so the actual population density of areas outside of these towns is considerably lower than 0.34 persons per square mile. This is typical of and consistent with the rest of rural northern Nevada, where population tends to be clustered around small towns and cities which grew up as mining towns, local commerce centers serving the surrounding rural areas, or railroad camps. In addition, approximately 81% of Eureka County land is federal land managed by the Bureau of Land Management and the U.S. Forest Service, making these areas presently unavailable for settlement.

Population Age Distribution
Eureka County has a relatively young population. 30% of the county population, or 424 people, are under the age of 20. 53% of the population, or 750 people, are between age 20 and 60, while only 17% (248 people) are age 60 or older. This is consistent with Nevada as a whole: in both the county and the state over 50% of residents are in the working age group of 25-64.

Population by Race
87.2% of the 2006 population of Eureka County, as projected by the Nevada State Demographer, was white. This is higher than in Nevada as a whole, where the percentage of white persons in the population in 2003 was projected to be 61.8%. People of Hispanic origin were projected to make up 9.8% of the 2006 Eureka County population, in comparison to 23.6% statewide. American Indians made up 1.8 % of Eureka County population, a higher percentage than in the state as a whole, which had an estimated 1.3% American Indian population. All other races accounted for 1.3% of the projected 2006 Eureka County population.

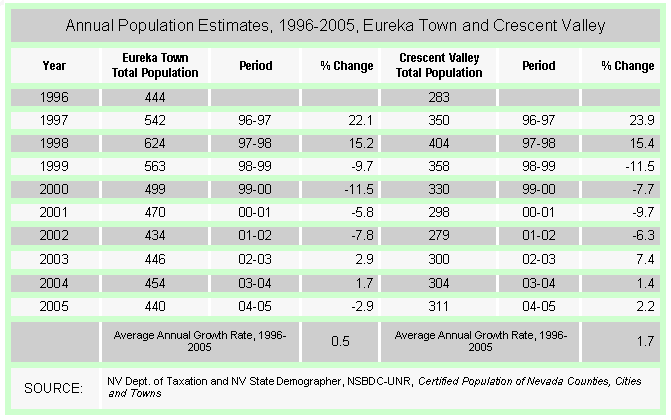
Countywide population trends are mirrored in Eureka town and Crescent Valley. Both town populations increased until 1998, decreased to 2002, then rose again subsequent years. The overall rate of growth between 1996 and 2005 in Eureka town was 0.5%; in Crescent Valley 1.7%.


Eureka County Housing

Overall housing units in Eureka County increased from 801 units in 1993 to 888 in 2006. Mobile homes remained the dominant housing type, accounting for 69% of county housing in 2006. Mobile homes account for 95% of the housing units in Crescent Valley, and 44% of Eureka town's housing Total housing units in Eureka County dropped between 2002 and 2003, from 901 to 880 units. Thirty-eight mobile homes left the county during that year, and some abandoned homes in Eureka town were removed from the tax roles.


References: Population and Housing

1. Annual Population Estimates
Nevada County Population Estimates July1, 1990 to July 1, 2005 Includes Cities and Towns. Nevada Small Business Development Center, Nevada State Demographer, Data and Publications.
Annual estimates by Nevada State Demographer each July

2. Population and Population Component
Fertility Module (1990-2004). Nevada State Health Division, Nevada Interactive Health Database System

Mortality Module (1990-2004). Nevada State Health Division, Nevada Interactive Health Database.

3. Other Population Statistics for Eureka County
Age, Sex, Race and Hispanic Origin Estimates from 1990 to 2003 and Projections from 2004 to 2024 for Nevada and Its Counties. June 2004 Nevada Small Business Development Center, Nevada State Demographer, Data and Publications.
Annual estimates by Nevada State Demographer each July

State and County Quick Facts, Nevada and Eureka County. U.S. Census Bureau.
U.S. Census Taken Every 10 Years

4. Annual Population Estimates, Eureka Town and Crescent Valley
Nevada County Population Estimates July 1, 1990 to July 1, 2005 Includes Cities and Towns. Nevada Small Business Development Center, Nevada State Demographer, Data and Publications.
Annual estimates by Nevada State Demographer each July

5. Housing Units by Type of Structure
Housing Unit Count for July 1, 2006, Final Certification for 2002 {2003, 2006] Estimates. J. P. Ithurralde, Eureka County Assessor.
Annual housing count by Eureka County Assessor completed each July


Population & Housing
Eureka County, Nevada
Socioeconomic Conditions and Trends Update
October, 2006

Report Quick Links


Pervious Page

Next Page

Table of Contents
Home