|
Travel, Tourism and Economic Development
The Eureka Sentinel Museum is in the 1879 Eureka Sentinel Newspaper Building, site of the town's longest running newspaper. The museum displays artifacts from Eureka's 1870s mining era and contains a complete nineteenth century press room. 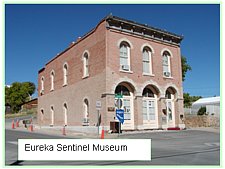 The ground floor of the building was made into a county historical museum in 1982, and in the year 2000 the museum expanded to include both floors of the building. Visitation to the museum has been increasing over the two decades since its opening, but not steadily. Visitation to the museum reached a high of 5,083 visitors in 1995, and then declined in subsequent years. In 2017, total visitation reached 4,186 (Table 3-12). The trend in visitation is shown in Figure 3-13. It should be noted that approximately one-third of all visitors do not sign into the museum. As a result, total visitation is probably understated. The ground floor of the building was made into a county historical museum in 1982, and in the year 2000 the museum expanded to include both floors of the building. Visitation to the museum has been increasing over the two decades since its opening, but not steadily. Visitation to the museum reached a high of 5,083 visitors in 1995, and then declined in subsequent years. In 2017, total visitation reached 4,186 (Table 3-12). The trend in visitation is shown in Figure 3-13. It should be noted that approximately one-third of all visitors do not sign into the museum. As a result, total visitation is probably understated.
The museum is an important part of Eureka's historical and architectural heritage, and as such serves as an indicator of the potential for development of historical tourism in the region. Visitation to the museum also is a rough indicator of the current level of tourism in the town. The museum is within the Eureka Historic District, designated in 1973. Also, in the historic district is the Eureka Opera House, built in 1880 and restored in 1994.
Eureka County continues to pursue diversified economic development. In Eureka County's 2011 Comprehensive Annual Report this effort is summarized as follows: "The County continues to look to other industries such as tourism and agriculture for possible economic development. With the preservation of many historic buildings, the County hopes tourism will be enhanced. The County is still providing the community with Internet access and a county web page is available at www.co.eureka.nv.us.
Two other measures of county economic activity are room tax (Table 3-13) and gaming license collections (Table 3-14). Eureka County has 88 motel rooms, 6 eating establishments, 5 gaming and entertainment establishments, and 3 RV parks. Room tax collections continue to climb nearing $100,000 annually, but dropped during 2015 and 2016. Future increases in room tax revenues will depend upon the total number of hotel rooms in the County and the rates charged. In 2015 and 2016, occupancy rates were lower due to reduced mining exploration, construction and operating activity.
Gaming license collections have remained steady, albeit with a large jump in collections in 2001. Unless increased licensing occurs, gaming license collections are likely to remain flat. Increasingly Eureka County is experiencing higher levels of outdoor recreation use. Hunting, fishing, camping, hiking and mountain bike riding are popular activities in Eureka County.
Figure 3-14 and Table 3-15 show the average daily traffic counts on Eureka County highways. U.S. Highway 50 serves central and southern Eureka County, accommodating not only local traffic, but long-distance travel through central Nevada. State Route 278, the Eureka-Carlin Road, serves as a link between northern and southern Eureka County, as well as access to Interstate Highway 80 and the City of Elko. State Route 306 provides access to Crescent Valley. Interstate 80, in the northern section of the county, is one of the nation's principle interstate highways. Highway 50 traffic increased annually with periodic declines reflecting in town trips. Peaks in traffic volume typically correspond to mining activity in the area. Traffic on SR 278 increased to 2001, then decreased again by 2004. Average daily traffic on Interstate 80 continues to grow in an upward trend line.
Fluctuations in traffic counts also reflect national economic conditions and factors which directly affect vehicle traffic such as fuel prices. The recession of 2008 has had long lasting impacts on average daily traffic counts. At the same time, mining activity in the region has increased, offsetting some of the impacts from national economic conditions. The traffic counts on the rural section of the highway, therefore, more closely represent through traffic on U.S. Highway 50. Since this traffic count would include recreationists, tourists, and other travelers, it is possibly a measure of previous economic development efforts targeting out-of-area visitors, as well as one estimate of the size of market for any potential visitor-or-tourism-related economic development efforts. In comparison to other rural principal arterials in Nevada, U.S. Highway 50 in the Eureka vicinity receives a mid-range of traffic. Table 3-16 shows traffic counts on selected sections of other rural Nevada arterials.
|
 Table 3-7 and
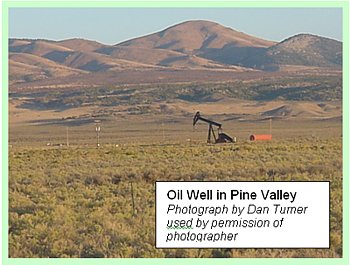 According to the Nevada Division of Minerals, Nevada's net oil production in 2013 was 335,671 down from 454,592 barrels (0.023% of total U.S. production) in 2006. 2016 production dropped to 278,599 barrels. There are 67 actively producing wells in 16 fields in Railroad Valley (Nye County, 89.4%) and three fields in Pine Valley (Eureka County, 10.6%). The North Willow Creek and Three Bars fields in Eureka County have not produced oil in recent years (Table 3-9). Nevada accounted for only 3 Percent of the total oil produced in the United States.
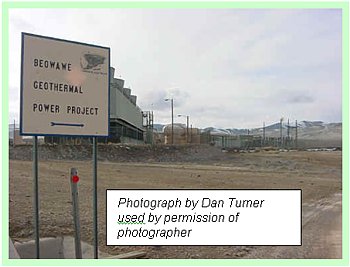 Geothermal Energy